Sunday, October 27, 2013
SV#4: Unit I Concept 2 - Graphing logarithmic equations and finding their properties
Hello, my name is Ivan and for this video we will be graphing a logarithmic equation and finding its properties. In order to understand, the viewer must pay special attention to the conversion of "h"'s sign and how to identify the vertical asymptote (x=h). To solve for x-intercept you have to use unit H skills, including exponentiating. Remember that the domain must correlate with the asymptote. Also, when plugging into your calculator, make sure the change of base is done properly, including the paranthesis. When choosing points, remember to choose the correct values to obtain an adequate graph. Lastly, don't forget to add the arrows to indicate this function continues forever.
THANK YOU!
Thursday, October 24, 2013
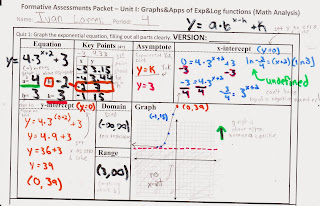
SP#3: Unit I Concept 1 - Graphing exponential functions and identifying their properties
My name is Ivan and THANK YOU!
Wednesday, October 16, 2013
SV#3: Unit H Concept 7 - Finding logs given approximations
In order to understand, the viewer needs to pay special attention to their clues. These clues are what guide you to the rest of the problem and what start you off. When trying to expand the numerator and denominator of the log by using the factor tree, you can only use the clues in the factor tree. The "branches" in your factor tree should all be a number that is found in the clues. Make sure all your branches are or your problem answer will be incorrect. Before you check your branches make sure the clues you already know (refer to the video if you don't know what I'm talking about). If a branch is not one of the numbers found in the clue, you must keep factoring until they are. If no further factorization is possible and your factor tree branches are still not numbers found in the clue then you must multiply by 2 or 3 or 4, etc (could be any number) and factor tree again until they are. Luckily, that is not the case in this problem because all the factors are prime numbers. After you have your logs, expand using the product and quotient laws. Make sure if you have more than one of the same clue you add the number of same clues as a number coefficient in front of your log (since it is the same it is like a number exponent --- power law), this will mean you have that many of the values in the clues. Combine like terms at the end so your final answer after substitution is correct. Other than that, you're all set.
Good luck and thank you!
Sunday, October 6, 2013
SV#2: Unit G Concepts 1-7 - Finding all parts and graphing a rational function
Hello my name is Ivan and this video will demonstrate how to graph a rational function. To graph this function, we will need to find it's assymptotes and some of the points that lie in its path, some of which are the y-intercepts and x-intercepts. We will also be using our graphing calculator to list some limit notation and figure out which general path our curves will follow. Make sure to find all you can first before graphing.
The viewer must pay special attention to the factorization of the bottom and top. The top will require some Unit F skills and if you go wrong, your graph may not end up looking correct. When finding vertical assymptotes, if something cancels out, do not forget to take it out from the simplified equation and find it's y-value by plugging it's x-value to the simplified equation. Make sure you cancel out the denominator when finding x-intercepts. Also, use the simplified equation when finding the y-intercepts. We must do this because we have a hole, and plugging x as 0 into the original equation could yield an incorrect value for the y-intercept. Make sure you use your trace function with the calculator so you obtain correct points. Remember, the graph has to hug the assymptotes and it cannot go through the hole we found.
Thank You
Subscribe to:
Comments (Atom)
